
Birdie Release Notes 3.3.0: Course Breakdown now shows where the damage is done
Your score tells you what happened. The new Course Breakdown shows where the damage was done—and which holes deserve a different plan next time.
Your total score can tell you that the round went wrong. It is less helpful at explaining whether the damage came from one recurring disaster hole, a collection of three-putts, or the driver taking an unscheduled tour of the trees.
Birdie Lab v3.3.0 completely rebuilds Course Breakdown around that problem. The new report uses your own hole-by-hole history to show where a course creates scoring pressure, which holes offer the best opportunity, and which recorded pattern is most closely associated with the scores on each hole.
No mystery formula. No imaginary strokes-gained number. Just the evidence from the rounds you actually played.
One course report. One version of the truth.
The old Course view had useful data, but it made you work too hard to connect it. We have reorganised the entire experience into a clearer post-round report, with every section using the same course, tee and time-period filters.
You can now switch between All Tees or a specific tee colour, then analyse All Time, This Year, the Last 100, Last 50, Last 10, or just your Last Round.
That means “Last Round from the Yellow tees” now means exactly that—not the latest round from whichever tees happened to get into the calculation first.
See what the course is costing you
At the top of Course Breakdown, six outcome metrics give you the shape of your performance:
Average 18-hole score
Average score against your target
Fairway or straight-tee percentage
Greens in regulation
Putts per evaluated hole
Rounds analysed
Then come the numbers golfers usually remember without wanting to: penalty strokes, three-putts, bunker-involved holes and double bogey-or-worse scores.
Together, these separate a generally difficult course from a round that was fine until two holes caught fire.
Three Course Findings that stay grounded in the data
Course Breakdown now gives you three fixed findings instead of rotating through generic advice:
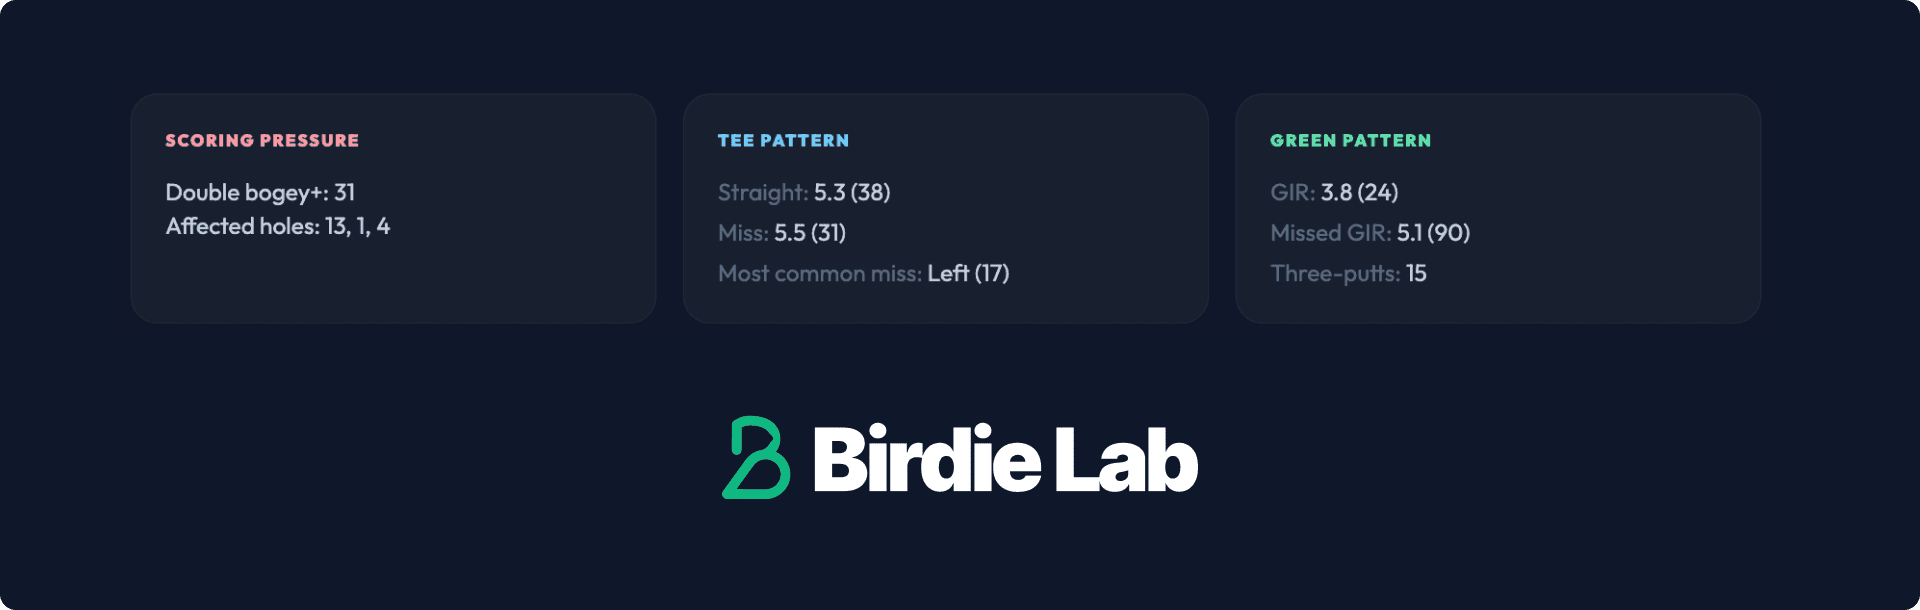
Scoring Pressure
See how many double bogey-or-worse holes appear in the selected rounds and which holes are most often involved.
Tee Pattern
Compare your average score after a recorded straight tee result with your average after a miss, including the miss direction that appears most often.
Green Pattern
Compare scoring when you hit the green in regulation with scoring when you miss it, alongside your three-putt count.
These are direct comparisons, not claims that one event definitely caused the score. Golf is already full of people confidently diagnosing your swing after watching one shot. Birdie Lab does not need to join them.
Meet your Nemesis—and your Opportunity
Every hole is now measured against the target that applied when you played it. Birdie Lab uses the handicap recorded for that round where available, so an old round is not judged using the golfer you are today.
From there, Course Breakdown identifies:
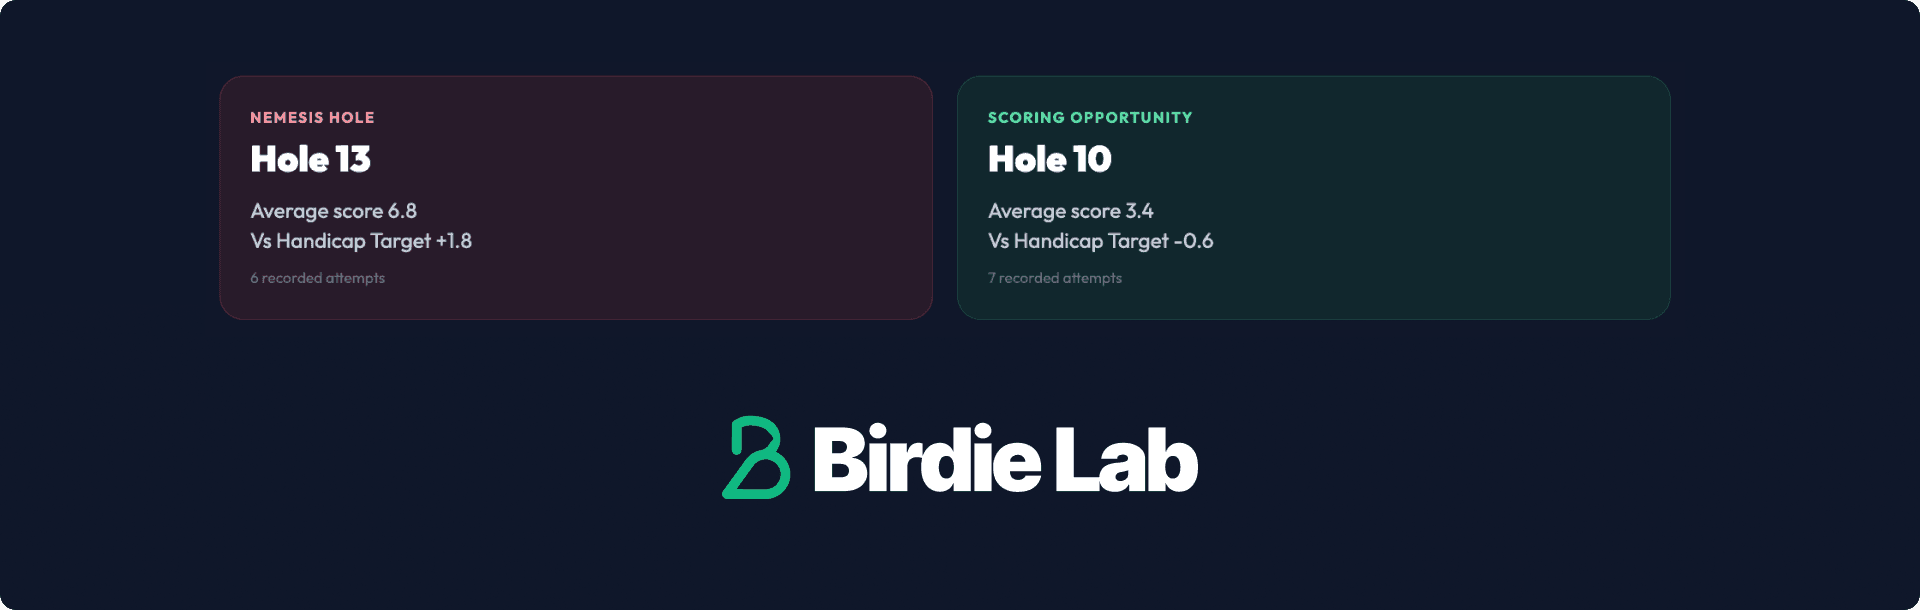
Nemesis Hole: the hole where your average score sits furthest above target.
Scoring Opportunity: the hole where your average score performs best against target.
The new 18-hole matrix makes the rest of the course easy to scan. Every tile shows the average score, the signed difference against target and the number of attempts. Emerald marks holes at or below target, amber flags holes to watch, and rose highlights the strongest scoring pressure. The value is always written out too, because colour should support the answer—not hide it.
Open any hole and inspect the evidence
The per-hole report has also been rebuilt. Instead of a collection of broad diagnostics, it now starts with the result and works backwards through the recorded facts.
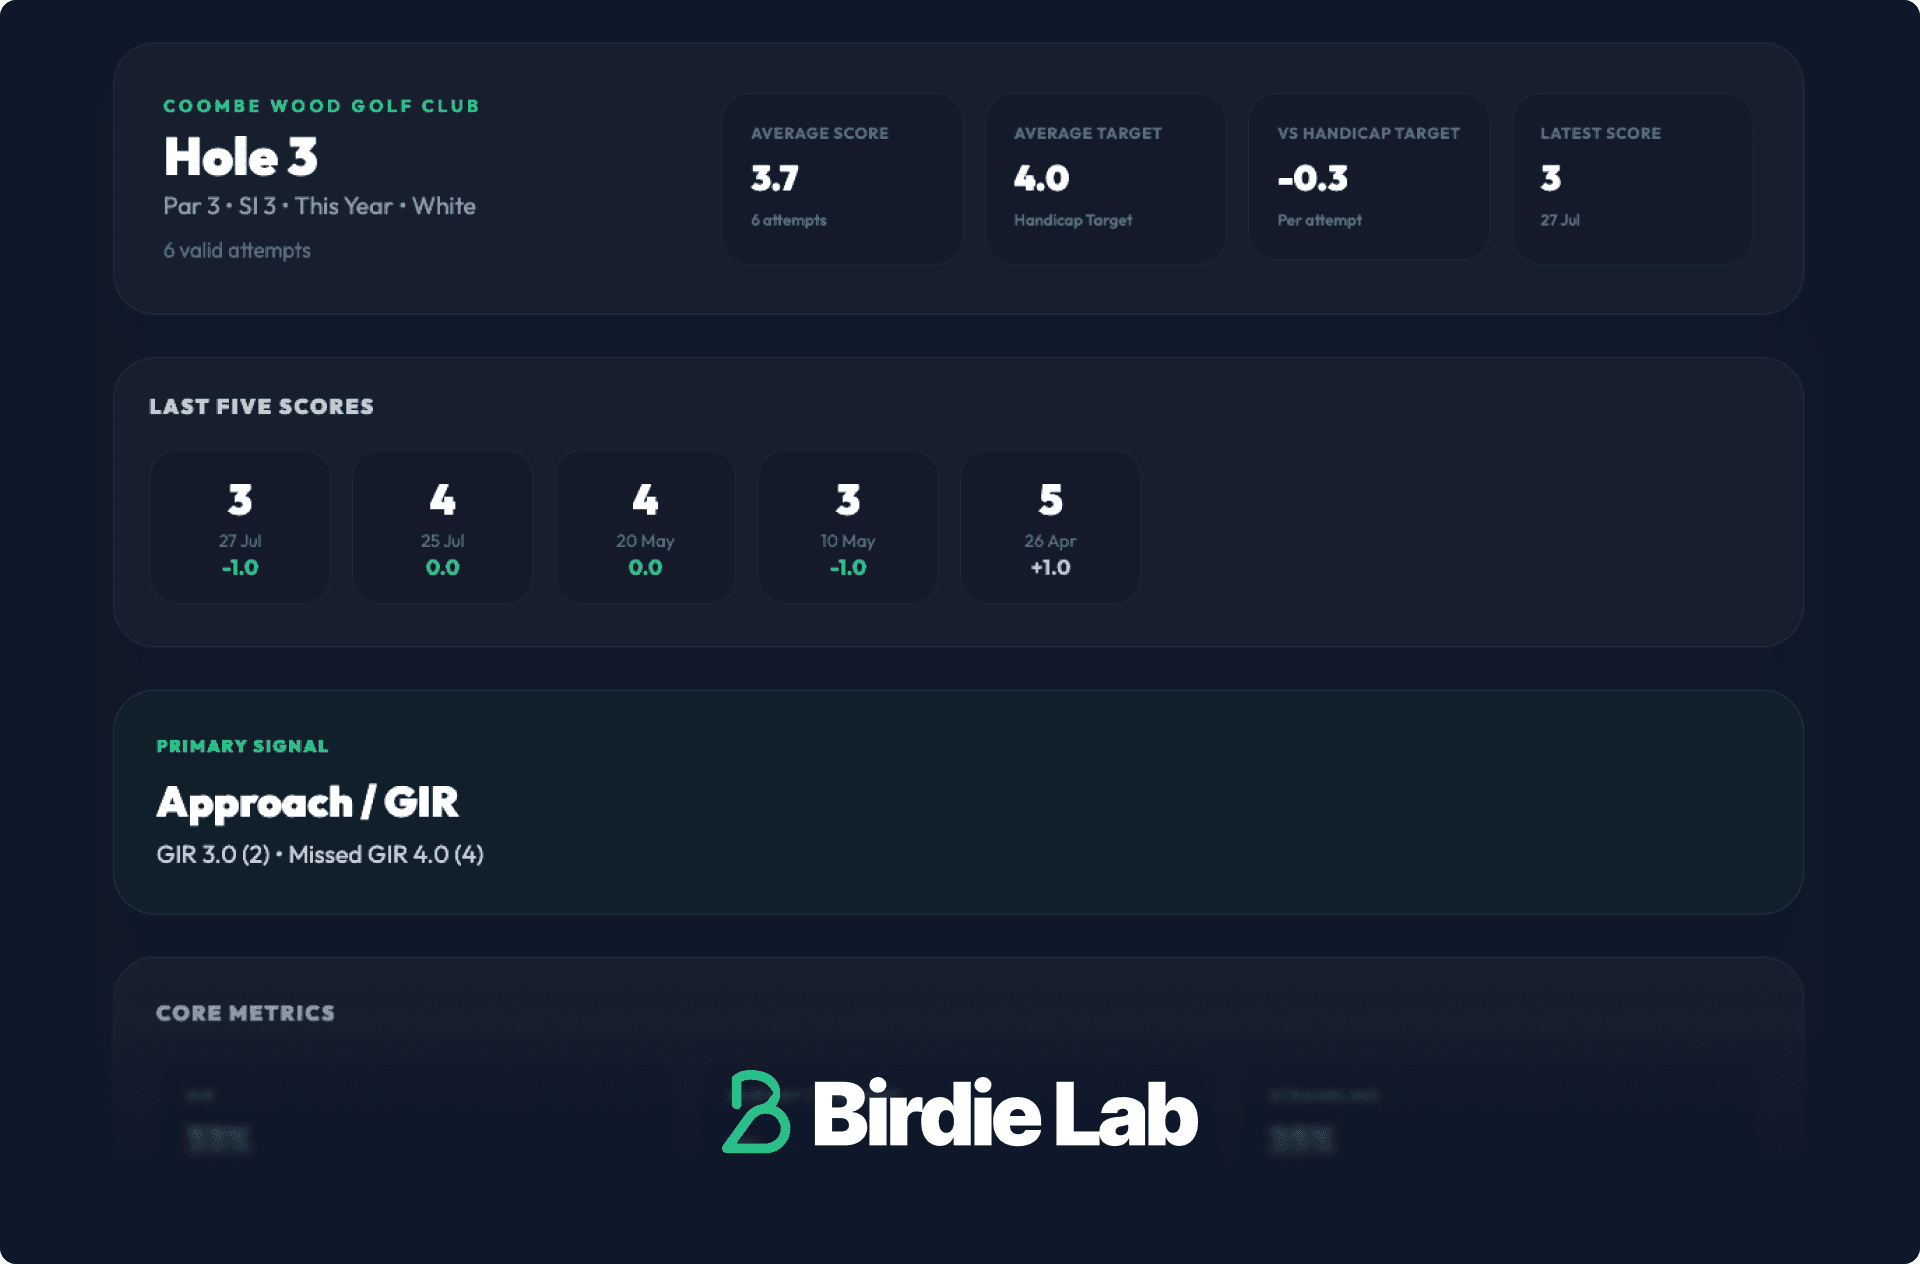
For each hole, you can see:
Your five most recent scores and how each compared with its target
A single Primary Signal based on repeated recorded patterns
GIR, fairway or straight-tee rate, scrambling, putting, penalties, bunker involvement and double bogey-or-worse frequency
Direct scoring comparisons for straight versus missed tee shots, GIR versus missed GIR, 0–2 putts versus 3+, penalties and bunker involvement
A complete five-attempt Hole History with tee, score, target result, direction, GIR, putts, penalties and bunker involvement
The Primary Signal follows a fixed set of rules. It might surface repeated penalties, three-putts, a meaningful GIR difference or a tee-result pattern. If the history does not contain a repeated pattern, it simply says No Single Pattern. Sometimes the honest answer is that you need more rounds—not a motivational paragraph generated from two bad swings.
Partial rounds still count where they should
Nine-hole and incomplete rounds no longer muddy the 18-hole scoring trend, but their valid holes are not thrown away.
A partial round can still contribute to your hole history, Course Findings, costs, Nemesis and Opportunity calculations. It just will not be presented as an 18-hole score. When there are fewer than three attempts, Birdie Lab marks the result Low data while still showing everything available.
Missing information also stays missing. If an older import did not confirm penalties, bunker involvement, putts or a tee result, Birdie Lab shows a dash instead of quietly turning “unknown” into a perfect zero.
More room in the Training Center
You can now save up to 10 Training Center sessions, increased from four. Keep separate plans for wedges, putting, driving, pre-round warm-ups or the specific parts of your game that need repeatable work—without deleting a useful session every time you create another one.
Why v3.3.0 matters
Course Breakdown is no longer there to decorate your score history. It is there to help you answer a practical question before you return to a familiar course:
Which holes deserve a different plan, and what does my own data say about them?
Open The Lab, choose a course, and start with the hole that keeps taking more than its fair share of your scorecard.